
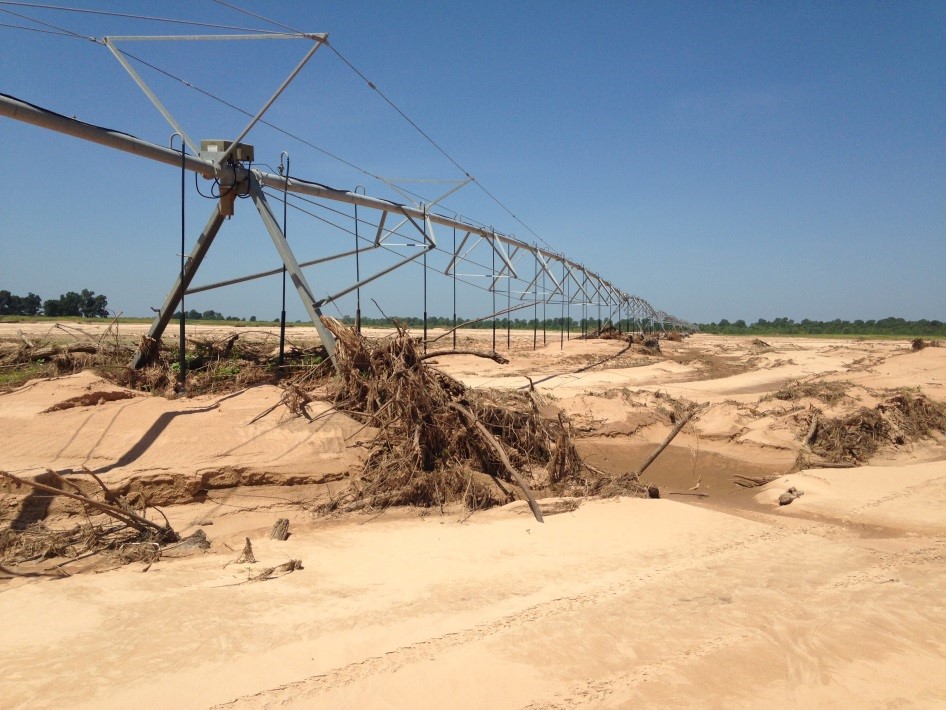
Pivot used for agricultural irrigation, previously surrounded by waist-high corn buried under sediment deposited by flood waters. Courtesy of USDA Farm Service Agency
USDA’s Farm Service Agency (FSA) is using Geographic Information System (GIS) technology to facilitate the damage assessment process after flooding in Texas. Farm and ranchland in Bowie County, Texas, along the Red River was submerged underwater for most of the month of June following torrential rains in Texas and Oklahoma. In addition to the rainfall, Bowie County experienced significant flooding as a result of water let out from Lake Texoma, one of the nation’s largest reservoirs.
According to Cody Grayson, County Executive Director, Bowie County FSA, producers reported losses in Bowie and Red River counties totaling more than 51,000 acres of cropland and more than 14,000 head of displaced cattle.
“One producer here in Bowie County lost all of his crops and had to haul all of his cattle to another location to save them from the flood. His fences and fields are completely covered with debris,” said Grayson. “This year will be a total loss for this producer in all aspects of his operation. The crops are gone and he has to pay to keep the cattle on another producer’s property.”
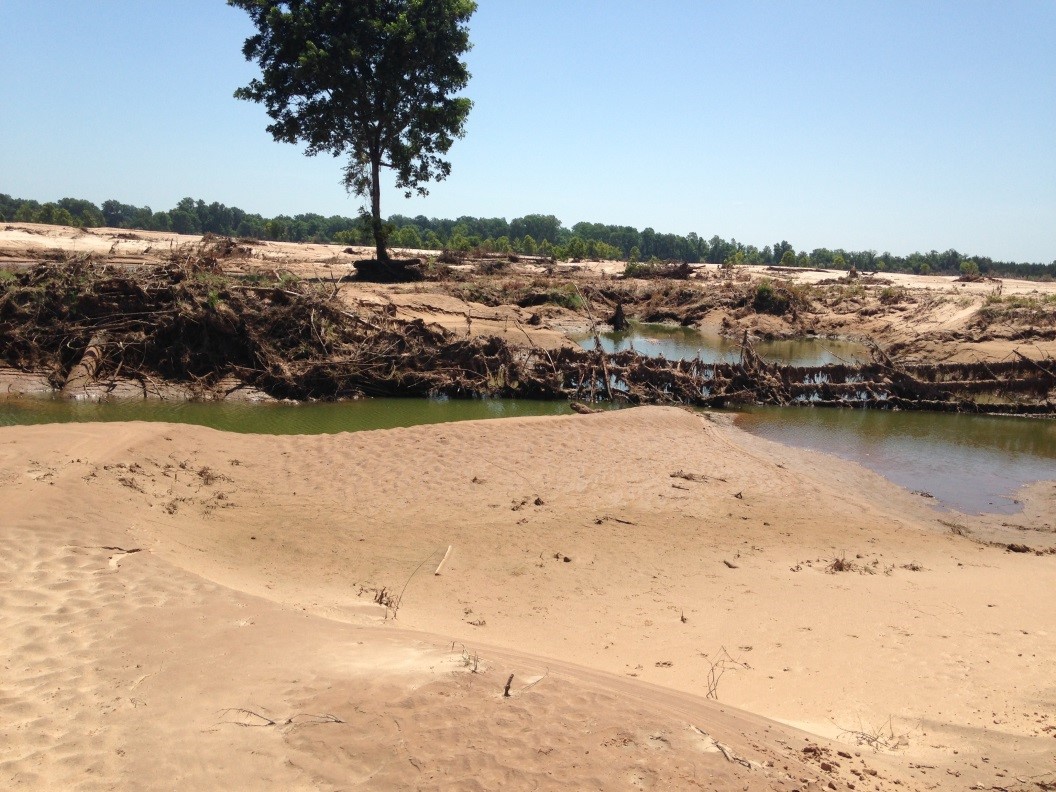
Producer’s fence formerly on level ground, now fallen and covered with debris. Courtesy of USDA Farm Service Agency
Through GIS, Grayson helped producers estimate how many feet of fence will need rebuilding and although some producers have the equipment to measure fields, many producers impacted by the floods do not, so FSA uses GIS to help determine how many acres of crop and pasture ground was impacted by sediment and debris in an effort to estimate extent of damages and costs to rehabilitate the land.
In early June, the Red River crested at 35 feet at a point midway between Bowie and Red River Counties. Through a coordinated effort with the Hazards Data Distribution System (HDDS), Amy McCoslin, GIS Specialist with FSA in Texas, supplied satellite imagery to Grayson that captured the time of peak flooding.
Using the imagery overlays, Grayson takes an image of flooded acres and overlays the image with a map reflecting county land use and from that, he and his staff can determine approximately how many acres of cropland are impacted by the flooding and, based on typical county stocking rates for livestock, they can estimate how many cattle might have been displaced during a specific weather event.
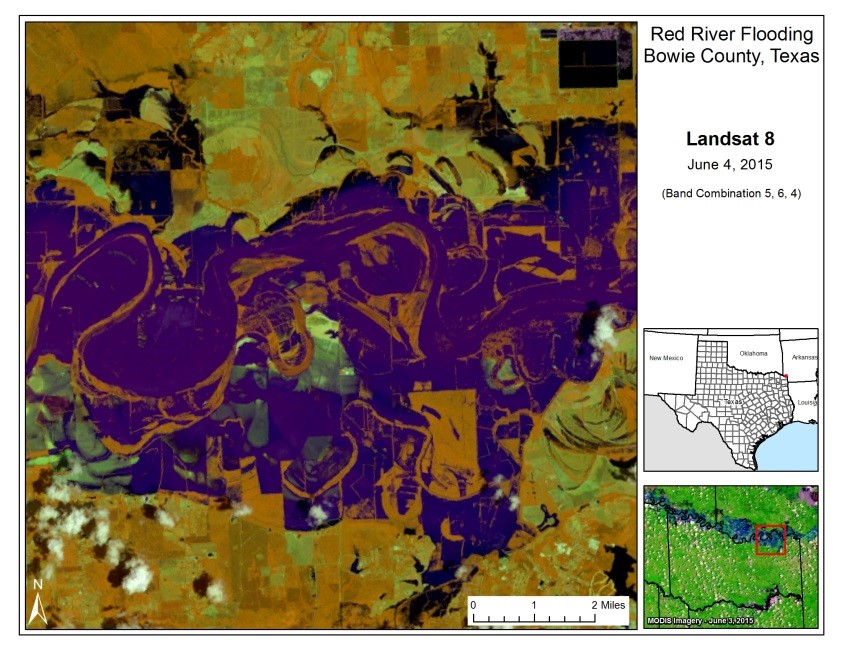
Landsat 8 satellite image of flooding along the Red River between Bowie County, TX and Little River County, AR. Blue area indicates locations affected by floodwaters. Courtesy of USGS/NASA Landsat Program,
“In the FSA State Offices, it is important to get the right imagery at the right time. We are sending our county offices imagery from multiple, reliable sources,” said McCoslin.
According to McCoslin, as soon as the imagery is available, she uploads it internally so that so that the images can be immediately accessed by FSA county offices which Grayson stresses is beneficial in calculating losses for County Emergency Boards to consider and is useful to FSA staff as they implement various FSA disaster assistance programs.
This article is part of a series that highlights how GIS is streamlining processes at FSA.
For questions regarding GIS, please contact Shirley Hall, FSA GIS Program Manager.


One Response to Mapping the Ag-Nation: GIS and Imagery Helps when Disaster Strikes Texas