
A map allows information based on location, such as an address, to be represented graphically. It allows a person to paint a picture for the viewers of the information so they can see the geographic location of particular features. It does other things as well, like generate an historic image of the way things were on a specific date.
As maps relate to actual geographic conditions, they are useful tools, but maps on their own do not lend easily to making decisions or finding solutions to geospatial problems, such as flood vulnerabilities or boundary disputes. Instead of trying to identify connections between data charted on multiple layers of physical map overlays, a tactic used in the past to find solutions to complex spatial problems, USDA’s Farm Service Agency (FSA) turns to Geographic Information Systems (GIS).
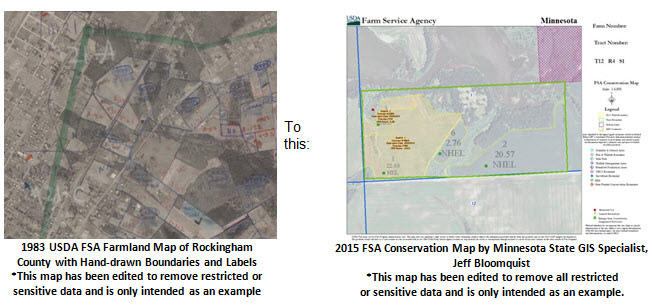
GIS describes any automated system for spatially managing and analyzing geographic information that can be tied to a place on the ground. This system, largely developed through the work of Roger Tomlinson in 1962, provides the ability to compile and analyze multiple layers of data simultaneously. It has shaped how FSA produces maps. Essentially, GIS allows an FSA agricultural map to quickly go from this 1983 FSA Farmland map of Rockingham County, Virginia, with hand-drawn field boundaries and labels that would have taken a few days to draw:
The various programs offered by FSA help agricultural producers across the Continental United States, Hawaii and Alaska, and United States territories, including American Samoa, Guam, Puerto Rico, the Virgin Islands and the Northern Mariana Islands, purchase and operate farms, stabilize farm income, conserve land and water and recover from the effects of disasters.
In order to determine the benefits producers will receive for their participation in FSA programs, FSA must know the specific crop acreage or other land use information. GIS helps FSA staff efficiently measure land features by allowing computer-generated maps to interact with databases that store information about the land, known as attribute data.
GIS technology provides FSA county office employees the tools to help producers exercise good land stewardship, provide more accurate information needed for quick decision-making in the face of disasters or emergencies and reduces the amount of time a producer spends working with local FSA staff in order to participate in USDA programs. GIS helps farmers spend less time in the office and more time in the field.
There are many stories that show how GIS has streamlined FSA operations in the office and on the farm – impacting procedures for conservation and disaster management, providing opportunities for special projects in FSA state offices and bridging communication between FSA and producers the agency serves.
This introduction to GIS is the first in a series of articles that will focus on how GIS is used to improve business operations in the office and in the field throughout FSA.
For questions regarding GIS, please contact Shirley Hall, FSA GIS Program Manager.


2 Responses to Mapping the Ag-Nation: Exploring FSA GIS – An Introduction